Statistical Tools
Upload a spreadsheet and run calculators, AI-assisted analysis plans, numeric outputs, and figures.
Prepare the data
- CSV is usually safest. Remove merged cells, repeated title rows, and unclear headers before upload.
- Use one variable per column with a short, lowercase header (e.g.
age_years,group,systolic_bp). - Code missing values consistently — leave the cell blank or use a single token like NA. Avoid mixing 0, "missing", and blanks.
- Check that columns, units, groups, and category labels look right before analysis.
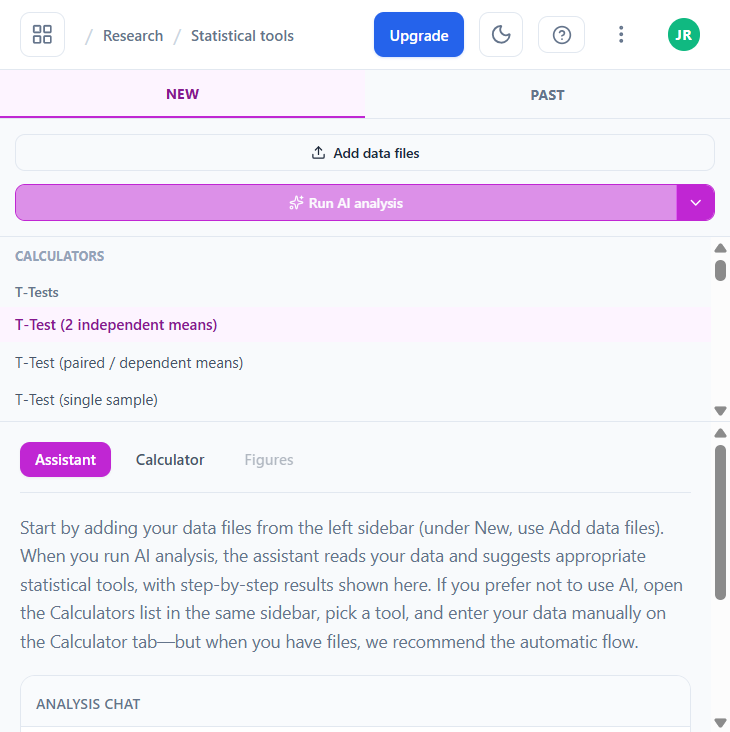
Run a calculation
- Open Statistical tools from Research home (you can run it without creating a full study).
- Use Add data files in the left sidebar and confirm that columns and types imported correctly.
- Either click Run AI analysis for a suggested step-by-step plan, or pick a calculator manually from the sidebar.
- Read results in Assistant (narrative output and recommendations) or Calculator (raw numbers) and open Figures for saved charts.
- Use the Past tab to revisit previous runs without re-uploading data.
What calculators are available
The sidebar groups standard tests so you can find them quickly: T-tests (independent, paired, single sample), one-way and two-way ANOVA (incl. repeated measures), Chi-square (2×2, R×C, goodness of fit), correlations (Pearson, Spearman, Kendall), non-parametric tests (Mann–Whitney, Wilcoxon, Kruskal–Wallis, Friedman), Z-tests, Fisher exact, binomial test, Levene/Brown–Forsythe, Cohen's kappa, outlier tests (Grubbs, generalized ESD), and descriptive statistics (skewness/kurtosis, IQR, sum of squares, coefficient of variation, standard error of estimate, critical values).
Review before publication
The numbers come from scripted tools, but method choice still needs judgment. For publication, regulatory, or high-stakes clinical work, ask a statistician to review assumptions (normality, homoscedasticity, independence, sample size) and interpretation before you cite a result.